Configure Traces
The NanoVNA-H supports up to 4 simultaneous traces, each displaying different measurements from either the S11 (reflection) or S21 (transmission) channel. This guide shows how to configure traces for your measurement needs.
Understanding Traces
Section titled “Understanding Traces”Each trace consists of three settings:
- Channel: S11 (CH0, reflection) or S21 (CH1, transmission)
- Format: How data is displayed (LogMag, Phase, Smith, SWR, etc.)
- Scale/Reference: Vertical scaling and reference position
Enable or Disable Traces
Section titled “Enable or Disable Traces”- Tap the screen to open the menu
- Navigate to
DISPLAY > TRACE - Tap the trace you want to toggle (TRACE 1-4)
- The selected trace toggles between enabled and disabled
Change Trace Channel
Section titled “Change Trace Channel”- Open the menu and go to
DISPLAY - Tap
CHANNELto cycle between S11 and S21 - This affects the currently selected trace
To change a specific trace’s channel:
- Go to
DISPLAY > TRACEand tap the desired trace to select it - Return to
DISPLAYand tapCHANNEL
Change Trace Format
Section titled “Change Trace Format”For S11 (reflection) measurements, navigate to DISPLAY > FORMAT S11 (REFL):
| Format | Description | Typical Use |
|---|---|---|
| LOGMAG | Logarithmic magnitude (dB) | Return loss, attenuation |
| PHASE | Phase angle (degrees) | Phase response |
| DELAY | Group delay (seconds) | Filter analysis |
| SMITH | Smith chart | Impedance matching |
| SWR | Standing wave ratio | Antenna tuning |
| RESISTANCE | Real impedance (ohms) | Component measurement |
| REACTANCE | Imaginary impedance (ohms) | Component measurement |
| |Z| | Impedance magnitude | Component measurement |
Additional S11 formats in MORE:
- POLAR, LINEAR, REAL, IMAG
- Q FACTOR, CONDUCTANCE, SUSCEPTANCE, |Y|
- Z PHASE, SERIES C, SERIES L
- PARALLEL R, PARALLEL X, PARALLEL C, PARALLEL L
For S21 (transmission) measurements, navigate to DISPLAY > FORMAT S21 (THRU):
| Format | Description | Typical Use |
|---|---|---|
| LOGMAG | Insertion loss (dB) | Filter response |
| PHASE | Transmission phase | Phase shift |
| DELAY | Group delay | Filter analysis |
| SMITH | S21 Smith chart | Matching networks |
| POLAR | Polar display | Complex S21 |
| LINEAR | Linear magnitude | Gain |
Additional S21 formats in MORE:
- SERIES R, SERIES X, SERIES |Z|
- SHUNT R, SHUNT X, SHUNT |Z|
- Q FACTOR
Shell Commands for Traces
Section titled “Shell Commands for Traces”Configure traces via serial console:
# Set trace formattrace {0|1|2|3} {format}
# Available formats:# logmag|phase|delay|smith|polar|linear|swr|real|imag|# r|x|z|zp|g|b|y|rp|xp|sc|sl|pc|pl|q|# rser|xser|zser|rsh|xsh|zsh|q21
# Examples:trace 0 logmag    # Set trace 0 to log magnitudetrace 1 smith     # Set trace 1 to Smith charttrace 2 swr       # Set trace 2 to SWRtrace 3 phase     # Set trace 3 to phase
# Set trace channel (0=S11, 1=S21)trace 0 logmag 0  # Trace 0, logmag, S11 channel
# Set scale and reference positiontrace 0 scale 10      # 10 dB/divtrace 0 refpos 7      # Reference at position 7 (of 8)
Stored Trace
Section titled “Stored Trace”The NanoVNA-H can store one trace for comparison:
- Go to
DISPLAY > TRACE - Tap
STORE TRACEto capture current trace data - Tap again to toggle display of stored trace
Stored traces appear in a different color and remain static while live traces update.
Default Trace Configuration
Section titled “Default Trace Configuration”The default setup shows:
- Trace 0: S11 LogMag (yellow)
- Trace 1: S21 LogMag (cyan)
- Trace 2: S11 Smith (green)
- Trace 3: S21 Phase (magenta)
Trace Format Examples
Section titled “Trace Format Examples”Here is how each common format looks on the display:
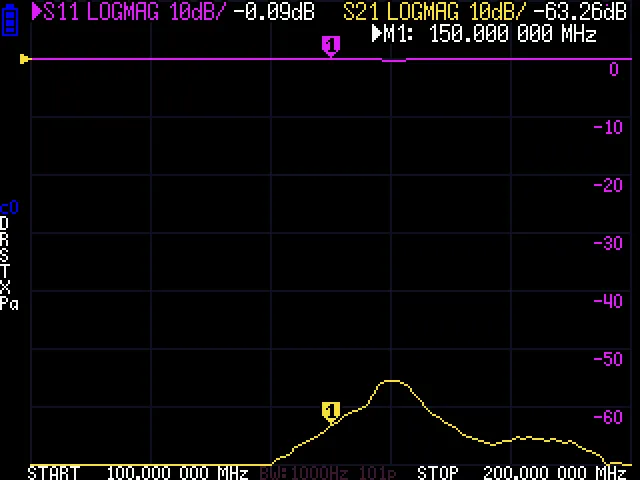
LOGMAG — Logarithmic magnitude in dB. The most common format for viewing return loss (S11) or insertion loss (S21).
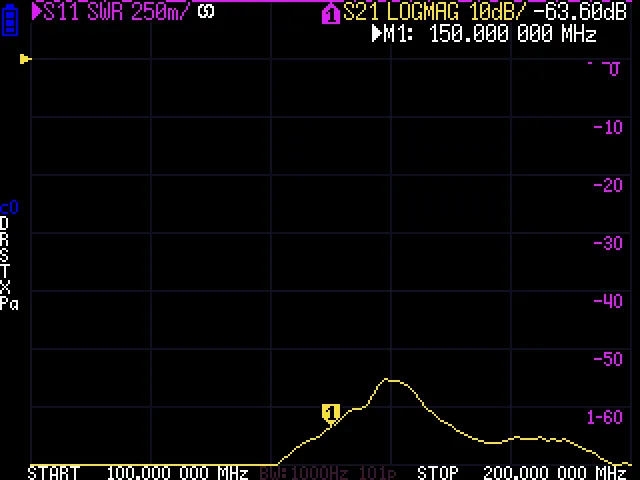
SWR — Standing wave ratio. Shows the impedance mismatch as a ratio, commonly used for antenna tuning.
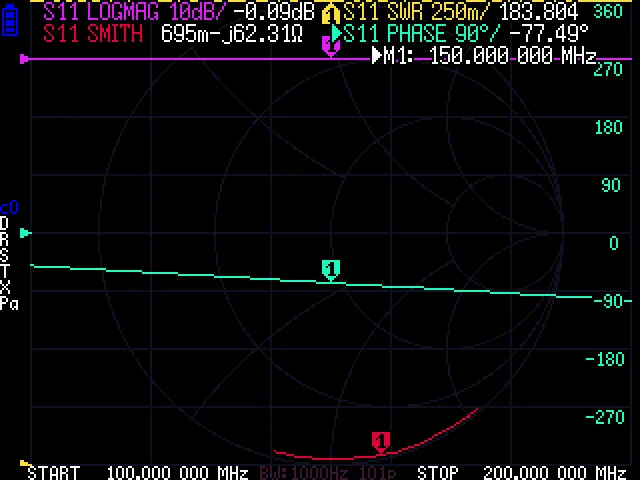
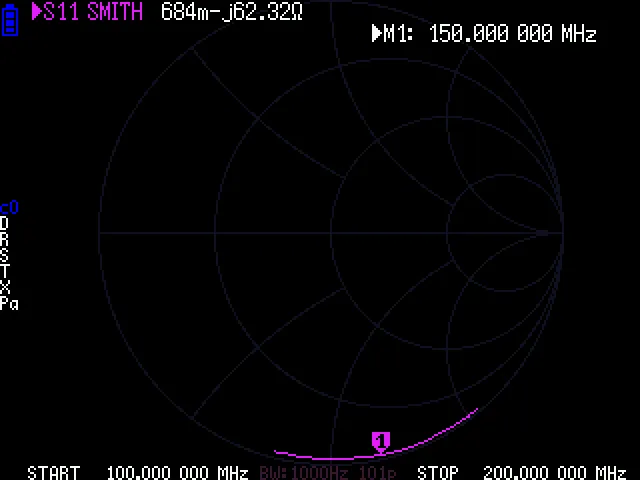
Smith Chart — Normalized impedance on a circular grid. Essential for impedance matching work.
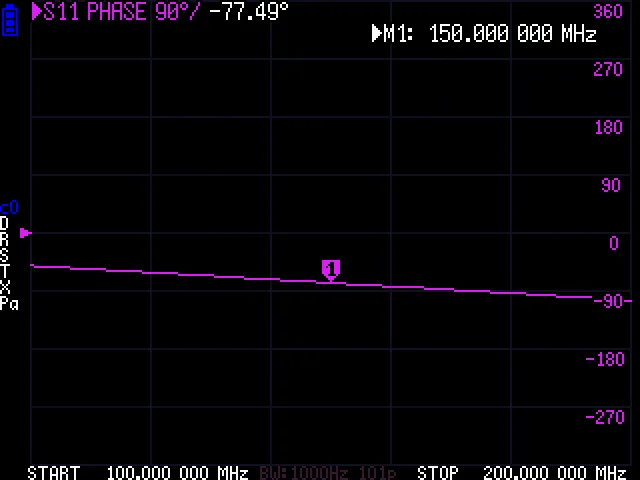
Phase — Phase angle in degrees. Shows how the phase of the reflected or transmitted signal varies with frequency.