Reading a Smith Chart
The Smith chart is a powerful tool for visualizing complex impedance. This tutorial explains how to read the NanoVNA’s Smith chart display.
What You Will Learn
Section titled “What You Will Learn”- The structure of the Smith chart
- How to read resistance and reactance
- Identifying common impedance conditions
- Using Smith chart marker formats
Why Use a Smith Chart?
Section titled “Why Use a Smith Chart?”The Smith chart displays impedance in a way that makes matching problems intuitive:
- A perfect match (50 ohms) is at the center
- Mismatches move away from center
- Inductive loads are in the top half
- Capacitive loads are in the bottom half
- Transmission line effects trace circles around the chart
Smith Chart Anatomy
Section titled “Smith Chart Anatomy”The Horizontal Axis (Resistance)
Section titled “The Horizontal Axis (Resistance)”The horizontal line through the middle represents pure resistance (no reactance):
| Position | Impedance | Meaning |
|---|---|---|
| Far left | 0 ohms | Short circuit |
| Center | 50 ohms | Perfect match |
| Far right | Infinite | Open circuit |
Resistance Circles
Section titled “Resistance Circles”The circles that touch the right edge represent constant resistance:
- Smaller circles = lower resistance
- The center point is on the 50-ohm circle (normalized to 1.0)
- Circles are labeled in normalized values (multiply by 50 for ohms)
Reactance Arcs
Section titled “Reactance Arcs”The curved lines (arcs) represent constant reactance:
- Top half: Positive reactance (inductive, +jX)
- Bottom half: Negative reactance (capacitive, -jX)
- Horizontal axis: Zero reactance (purely resistive)
Enabling Smith Chart Display
Section titled “Enabling Smith Chart Display”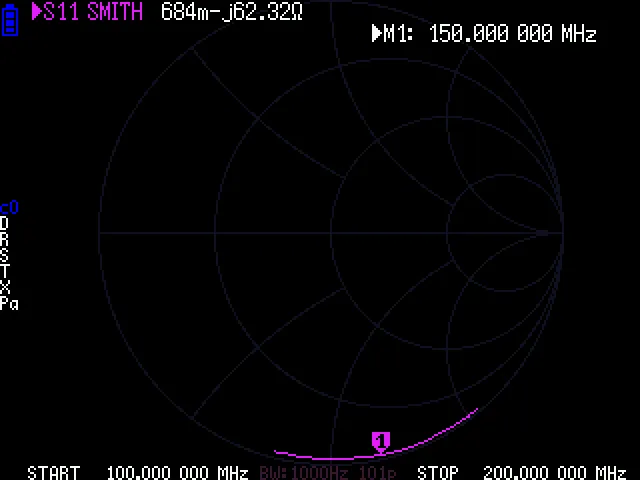
-
Select a trace
Touch the trace indicator (colored number) or go to DISPLAY > TRACE.
-
Set format to SMITH
Go to DISPLAY > FORMAT S11 (REFL) > SMITH
-
Choose marker format
The Smith chart supports multiple marker readout formats. Touch MARKER and select a marker, then the readout shows impedance.
Smith Chart Marker Formats
Section titled “Smith Chart Marker Formats”Access marker formats through the menu when Smith chart is active. The firmware supports these formats:
| Format | Display | Best For |
|---|---|---|
| R+jX | Resistance + Reactance | General impedance reading |
| R//LC | Parallel R, L, or C | Matching network design |
| G+jB | Conductance + Susceptance | Admittance analysis |
| Lin Mag | Linear magnitude | Reflection coefficient |
| Log Mag | dB magnitude | Return loss |
-
Change marker format
With Smith chart displayed, select a marker and touch the readout area, or navigate to the marker smith format menu.
-
Select your preferred format
Choose R+jX for standard impedance readings in ohms.
Reading Impedance on the Smith Chart
Section titled “Reading Impedance on the Smith Chart”Finding Your Point
Section titled “Finding Your Point”When you enable the Smith chart, the trace shows how impedance varies with frequency:
-
Locate the marker
The marker appears as a small triangle or dot on the trace.
-
Read the position
- Distance from center = magnitude of mismatch
- Angle from horizontal = phase of reflection coefficient
-
Read the marker values
The marker readout shows the actual impedance at that frequency.
Common Impedance Conditions
Section titled “Common Impedance Conditions”Location: Center of chart
Impedance: 50 + j0 ohms
Meaning: No reflected power, ideal condition
SWR: 1:1
Location: Far left edge
Impedance: 0 + j0 ohms
Meaning: All power reflected, 180-degree phase shift
SWR: Infinite
Location: Far right edge
Impedance: Infinite
Meaning: All power reflected, 0-degree phase shift
SWR: Infinite
Location: Upper half of chart
Impedance: R + jX where X > 0
Meaning: Load has inductive reactance (antenna too long)
Fix: Add series capacitor or shorten antenna
Location: Lower half of chart
Impedance: R - jX where X < 0
Meaning: Load has capacitive reactance (antenna too short)
Fix: Add series inductor or lengthen antenna
The Constant SWR Circles
Section titled “The Constant SWR Circles”Imagine circles centered on the chart center. These represent constant SWR:
- Center point: SWR = 1:1
- Small circle around center: SWR = 1.5:1
- Larger circle: SWR = 2:1
- Edge of chart: SWR = infinite
Transmission Line Effects
Section titled “Transmission Line Effects”When you add transmission line length, the impedance point rotates clockwise around the chart:
- One complete rotation = half wavelength of cable
- The rotation follows constant SWR circles
- Cable loss causes the trace to spiral inward
This is why calibrating at the antenna (not at the radio) gives more accurate results.
Example: Analyzing an Antenna
Section titled “Example: Analyzing an Antenna”-
Connect the antenna and set frequency range
Cover your band of interest with some margin.
-
Enable Smith chart display
-
Place marker at your operating frequency
-
Read the impedance
Example reading:
52.3 + j12.5ohms -
Interpret the result
- Resistance (52.3 ohms) is close to 50 ohms - good
- Reactance (+j12.5 ohms) is positive - slightly inductive
- The antenna is slightly too long or needs a small series capacitor
Matching Network Design
Section titled “Matching Network Design”The Smith chart excels at designing matching networks:
Moving Along the Chart
Section titled “Moving Along the Chart”| Component | Movement on Chart |
|---|---|
| Series inductor | Clockwise along constant R circle |
| Series capacitor | Counter-clockwise along constant R circle |
| Shunt inductor | Clockwise along constant G circle |
| Shunt capacitor | Counter-clockwise along constant G circle |
Using the L/C Match Function
Section titled “Using the L/C Match Function”The NanoVNA has a built-in L/C matching calculator:
-
Enable L/C Match
Go to MARKER > MEASURE > L/C MATCH
-
Place marker on your frequency
-
Read the suggested component values
The display shows suggested inductor and capacitor values to achieve a match.
Tips for Using the Smith Chart
Section titled “Tips for Using the Smith Chart”Zooming the View
Section titled “Zooming the View”The NanoVNA displays the entire Smith chart by default. For loads close to 50 ohms, most of the chart is unused. Use:
- Marker readouts for precise values
- Multiple traces if needed (LOGMAG + SMITH)
Frequency Direction
Section titled “Frequency Direction”As frequency increases, the trace typically moves clockwise (for inductive loads) or counter-clockwise (for capacitive loads). Mark your start and stop frequencies to understand the direction.
Multiple Resonances
Section titled “Multiple Resonances”Antennas often cross through the center of the chart (good match) at multiple frequencies. Use markers to identify each resonance and choose the one at your desired operating frequency.
Next Steps
Section titled “Next Steps”- Your First S11 Measurement - Practical antenna measurement
- L/C Matching Networks - Design matching circuits
- Tuning HF Antennas - Apply Smith chart knowledge